
Paid media reporting is a daunting task for both agencies and internal marketing teams. With large budgets, varied goals, and mountains of data, it can be difficult to present campaign results in a digestible format.
Recently, marketers have been working towards automating reporting as much as possible to reduce spending hours on manual data input. A tool for automated reporting is Google Ads scripts, which can be scheduled to run automatically to export data or update campaigns. However, many digital marketers do not have programming or JavaScript experience, so Google Ads scripts can feel overwhelming.
I was in this camp, with no programming background, I felt that Google Ads Scripts were a tool that I could rarely use beyond pre-made templates. But, I was able to use Claude.ai to create a Google Ads reporting script.
The Prompt
I wanted help exporting data into a Google Sheet with campaign results segmented by month. I prompted Claude:
Can you help me write a Google Ads Script that accomplishes the following:
- Exports the following metrics to a Google Sheet:
- Impressions
- Clicks
- CTR
- Avg. CPC
- Cost
- Conversions
- Conv. Rate
- Cost / conv.
- Search impr. share
- The metrics should be segmented by campaign
- The metrics should be segmented by month
- The metrics should be for active campaigns only
- The metrics should be from year to date
Claude immediately created a script with instructions on how to add it to the Google Ads platform. However, the initial script failed to export any data. But I was able to paste the errors from Google ads back into Claude, where the code was corrected and able to run without issues.
The Result
After running the revised script, my campaign data successfully exported to a Google Sheet.
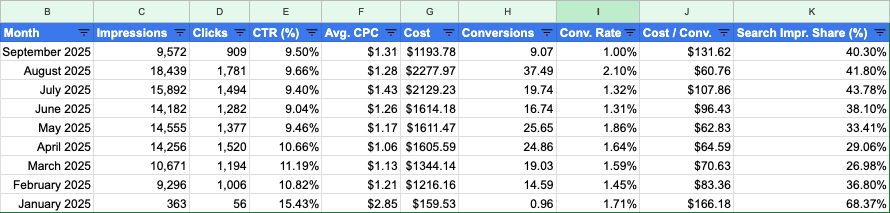
Now with the data formatted in a Google Sheet and segmented by month, I can easily create charts, apply heat maps, filter for best-performing months, paste tables into reports, and analyze the data without any manual input.
I can duplicate this script to other Google Ads accounts and schedule it to run automatically each month so that I always have relevant data in an easily usable format.
The Script
To use this script for your campaign reporting, you can simply copy the code below. The only change you will need to make is replacing YOUR_GOOGLE_SHEET_URL_HERE with a link to your Google Sheet.
function main() {
      // Configuration - Replace with your Google Sheet URL
      const SPREADSHEET_URL = 'YOUR_GOOGLE_SHEET_URL_HERE';
      const SHEET_NAME = 'Campaign Metrics';

      try {
        // Open the spreadsheet
        const spreadsheet = SpreadsheetApp.openByUrl(SPREADSHEET_URL);
        let sheet = spreadsheet.getSheetByName(SHEET_NAME);

        // Create sheet if it doesn't exist
        if (!sheet) {
          sheet = spreadsheet.insertSheet(SHEET_NAME);
        }

        // Clear existing data
        sheet.clear();

        // Set up headers
        const headers = [
          'Campaign Name',
          'Month',
          'Impressions',
          'Clicks',
          'CTR (%)',
          'Avg. CPC',
          'Cost',
          'Conversions',
          'Conv. Rate (%)',
          'Cost / Conv.',
          'Search Impr. Share (%)'
        ];

        sheet.getRange(1, 1, 1, headers.length).setValues([headers]);

        // Format header row
        const headerRange = sheet.getRange(1, 1, 1, headers.length);
        headerRange.setFontWeight('bold');
        headerRange.setBackground('#4285f4');
        headerRange.setFontColor('white');

        // Get year-to-date date range
        const currentDate = new Date();
        const startOfYear = new Date(currentDate.getFullYear(), 0, 1);

        console.log(`Fetching data from ${formatDate(startOfYear)} to ${formatDate(currentDate)}`);

        // Use a simpler query that gets daily data, which we'll aggregate by month
        const query = `
          SELECT
            CampaignName,
            Date,
            Impressions,
            Clicks,
            Ctr,
            AverageCpc,
            Cost,
            Conversions,
            ConversionRate,
            CostPerConversion,
            SearchImpressionShare
          FROM CAMPAIGN_PERFORMANCE_REPORT
          WHERE
            CampaignStatus = ENABLED
          DURING ${formatDate(startOfYear)},${formatDate(currentDate)}
        `;

        console.log('Running query...');

        const report = AdsApp.report(query);
        const rows = report.rows();
        const monthlyData = new Map(); // To aggregate data by campaign and month

        let rowCount = 0;

        // Process each row
        while (rows.hasNext()) {
          const row = rows.next();
          rowCount++;

          try {
            // Get values from the row
            const campaignName = row['CampaignName'];
            const dateStr = row['Date']; // Format: YYYY-MM-DD

            // Extract year and month from date
            const dateParts = dateStr.split('-');
            const year = dateParts[0];
            const month = dateParts[1];
            const monthKey = `${year}-${month}`;

            // Create a unique key for campaign + month combination
            const key = `${campaignName}_${monthKey}`;

            // Parse numeric values with proper error handling
            const impressions = parseInt(row['Impressions']) || 0;
            const clicks = parseInt(row['Clicks']) || 0;
            const ctr = parseFloat(row['Ctr']) || 0;
            const avgCpc = parseFloat(row['AverageCpc']) || 0;
            const cost = parseFloat(row['Cost']) || 0;
            const conversions = parseFloat(row['Conversions']) || 0;
            const conversionRate = parseFloat(row['ConversionRate']) || 0;
            const costPerConversion = parseFloat(row['CostPerConversion']) || 0;
            const searchImpressionShare = parseFloat(row['SearchImpressionShare']) || 0;

            // Format month name
            const monthName = formatMonthFromKey(monthKey);

            // If we already have data for this campaign+month, aggregate it
            if (monthlyData.has(key)) {
              const existing = monthlyData.get(key);
              existing.impressions += impressions;
              existing.clicks += clicks;
              existing.cost += cost;
              existing.conversions += conversions;

              // For impression share, we'll take the average (weighted by impressions)
              const totalImpressions = existing.impressions;
              if (totalImpressions > 0 && impressions > 0) {
                existing.searchImpressionShare = ((existing.searchImpressionShare * (totalImpressions - impressions)) + (searchImpressionShare * impressions)) / totalImpressions;
              }

            } else {
              // Add new entry
              monthlyData.set(key, {
                campaignName: campaignName,
                monthName: monthName,
                impressions: impressions,
                clicks: clicks,
                cost: cost,
                conversions: conversions,
                searchImpressionShare: searchImpressionShare
              });
            }

          } catch (rowError) {
            console.error('Error processing row:', rowError.toString());
          }
        }

        console.log(`Processed ${rowCount} rows, found ${monthlyData.size} unique campaign-month combinations`);

        // Convert map to array and calculate derived metrics
        const data = [];
        for (const [key, rowData] of monthlyData) {
          // Calculate derived metrics from aggregated data
          const ctr = rowData.impressions > 0 ? (rowData.clicks / rowData.impressions * 100) : 0;
          const avgCpc = rowData.clicks > 0 ? (rowData.cost / rowData.clicks) : 0;
          const conversionRate = rowData.clicks > 0 ? (rowData.conversions / rowData.clicks * 100) : 0;
          const costPerConversion = rowData.conversions > 0 ? (rowData.cost / rowData.conversions) : 0;

          data.push([
            rowData.campaignName,
            rowData.monthName,
            rowData.impressions,
            rowData.clicks,
            ctr,
            avgCpc,
            rowData.cost,
            rowData.conversions,
            conversionRate,
            costPerConversion,
            rowData.searchImpressionShare
          ]);
        }

        // Sort by campaign name, then by month
        data.sort((a, b) => {
          if (a[0] !== b[0]) return a[0].localeCompare(b[0]);
          return a[1].localeCompare(b[1]);
        });

        // Write data to sheet if we have any
        if (data.length > 0) {
          const dataRange = sheet.getRange(2, 1, data.length, headers.length);
          dataRange.setValues(data);

          // Format numeric columns
          formatNumericColumns(sheet, data.length);

          console.log(`Successfully exported ${data.length} rows of data to Google Sheet`);
        } else {
          console.log('No data found for the specified criteria');
          sheet.getRange(2, 1).setValue('No data found for active campaigns in the specified date range');

          // Debug: Try to get any campaign data
          console.log('Attempting to fetch basic campaign info for debugging...');
          try {
            const debugQuery = 'SELECT CampaignName, CampaignStatus, Impressions FROM CAMPAIGN_PERFORMANCE_REPORT WHERE CampaignStatus = ENABLED DURING LAST_30_DAYS';
            const debugReport = AdsApp.report(debugQuery);
            const debugRows = debugReport.rows();
            let campaignCount = 0;
            while (debugRows.hasNext() && campaignCount < 5) {
              const debugRow = debugRows.next();
              console.log(`Found campaign: ${debugRow['CampaignName']} (Status: ${debugRow['CampaignStatus']}, Impressions: ${debugRow['Impressions']})`);
              campaignCount++;
            }
            if (campaignCount === 0) {
              console.log('No active campaigns found in last 30 days');
            }
          } catch (debugError) {
            console.error('Debug query failed:', debugError.toString());
          }
        }

        // Auto-resize columns
        sheet.autoResizeColumns(1, headers.length);

        console.log('Export completed!');

      } catch (error) {
        console.error('Error in main function:', error.toString());
        console.error('Error stack:', error.stack);
      }
    }

    function formatDate(date) {
      const year = date.getFullYear();
      const month = String(date.getMonth() + 1).padStart(2, '0');
      const day = String(date.getDate()).padStart(2, '0');
      return `${year}${month}${day}`;
    }

    function formatMonthFromKey(monthKey) {
      // monthKey is in format "YYYY-MM"
      const monthNames = [
        'January', 'February', 'March', 'April', 'May', 'June',
        'July', 'August', 'September', 'October', 'November', 'December'
      ];

      const [year, month] = monthKey.split('-');
      const monthIndex = parseInt(month) - 1;

      if (monthIndex >= 0 && monthIndex < 12) {
        return `${monthNames[monthIndex]} ${year}`;
      }
      return `${monthKey}`;
    }

    function formatNumericColumns(sheet, dataRows) {
      if (dataRows === 0) return;

      // Format impressions, clicks (columns C, D) - no decimals
      sheet.getRange(2, 3, dataRows, 2).setNumberFormat('#,##0');

      // Format CTR (column E) - percentage with 2 decimals
      sheet.getRange(2, 5, dataRows, 1).setNumberFormat('0.00"%"');

      // Format Avg CPC, Cost, Cost/Conv (columns F, G, J) - currency
      sheet.getRange(2, 6, dataRows, 1).setNumberFormat('$0.00');
      sheet.getRange(2, 7, dataRows, 1).setNumberFormat('$0.00');
      sheet.getRange(2, 10, dataRows, 1).setNumberFormat('$0.00');

      // Format Conversions (column H) - 2 decimal places
      sheet.getRange(2, 8, dataRows, 1).setNumberFormat('0.00');

      // Format Conv Rate and Search Impr Share (columns I, K) - percentage
      sheet.getRange(2, 9, dataRows, 1).setNumberFormat('0.00"%"');
      sheet.getRange(2, 11, dataRows, 1).setNumberFormat('0.00"%"');
}Automating manual reporting steps should be a key priority for digital marketing agencies. Time wasted on exports, data entry, and formatting spreadsheets is time that could be spent on data analysis and campaign optimization.